Case Study
Introduction:
The project aimed to analyze historical Olympic Games data spanning more than a century. Utilizing data sourced from Kaggle, the project focused on cleaning, preparing, normalizing, and visualizing the data in Power BI to extract meaningful insights and highlight key trends in Olympic history.
Project Overview:
Objective: To explore and visualize extensive Olympic Games data to identify trends, top-performing countries, athletes, and gender distribution across various Olympic events and seasons.
Project Phases:
1. Data Collection and Preparation:
Sourced raw Olympic Games data from Kaggle, encompassing information on athletes, events, medals, and participating countries. Conducted data cleaning and preparation in Excel, addressing inconsistencies, missing values, and formatting issues. Organized the data to facilitate easier import and manipulation in Power BI.
2. Data Normalization using Power Query:
Imported cleaned data into Power BI and utilized Power Query to further refine and normalize the dataset. Resolved data inconsistencies, standardized naming conventions, and created relationships between tables for efficient data analysis.
3. Visualization and Analysis:
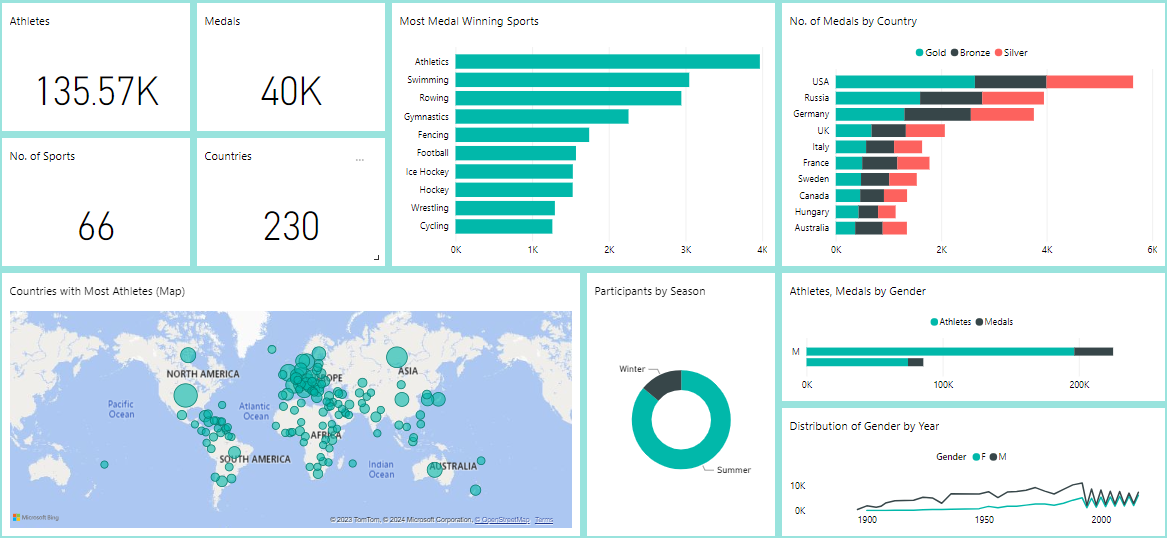
Developed a series of visuals and charts using Power BI to represent key factors and insights. Created visualizations to showcase top countries by medals, top athletes by medals, events categorized by season, and gender distribution across different Olympic Games.
4. Key Features and Insights:
Top Countries by Medals: Visual representations highlighting countries with the highest medal counts across all Olympic Games.
Top Athletes by Medals: Charts displaying the most decorated athletes in Olympic history.
Events by Season: Visual breakdowns of Olympic events categorized by seasons (Summer and Winter).
Gender Distribution: Comparative visuals showcasing the distribution of medals among male and female athletes.
5. Interactive Dashboard Creation:
Designed an interactive and user-friendly dashboard in Power BI, allowing stakeholders to explore data dynamically. Implemented slicers, filters, and drill-down functionalities for deeper analysis of specific metrics and time frames.
6. Insights and Outcomes:
Identified dominant countries in Olympic history based on medal counts across different games and sports. Showcased the evolution of top-performing athletes and trends in gender distribution over 120 years of Olympic history. Enabled stakeholders to gain insights into the patterns and changes in Olympic events across seasons and geographical regions.
Dashboard
Report
Conclusion:
The '120 Years of Olympic Games Review' project successfully transformed raw Olympic Games data into a visually engaging and informative dashboard using Power BI. By leveraging data cleaning, normalization, and visualization techniques, the project provided stakeholders with a comprehensive tool to explore and understand historical trends, top performers, and key factors influencing the Olympic Games over more than a century.