Case Study
Introduction:
The project involved the extraction, manipulation, and analysis of sales data sourced from SQL Server. Utilizing MySQL for data transformation, Excel for cleaning and preparation, and Power BI for normalization and visualization, the project aimed to derive actionable insights and visualize key performance indicators (KPIs) for sales analysis.
Project Overview:
Objective: To analyze sales data comprehensively by combining SQL Server data, performing data transformations in MySQL, cleaning in Excel, and visualizing insights in Power BI, focusing on best selling items, top paying customers, sales by company, category, territory, and time series analysis.
Project Phases:
1. Data Extraction and Transformation:
Extracted raw sales data from SQL Server and imported it into MySQL for data transformation and table combination. Performed necessary joins, filtering, and aggregation in MySQL to create a consolidated dataset with required tables and columns.
2. Data Cleaning and Preparation in Excel:
Conducted data cleaning in Excel to address inconsistencies, missing values, and formatting issues. Formatted the data to ensure compatibility and consistency before importing it into Power BI.
3. Data Normalization using Power Query in Power BI:
Imported cleaned and prepared data into Power BI and utilized Power Query for further data normalization. Split large columns into smaller ones to enhance performance and reduce redundancy in the dataset. Created relationships and a data model for efficient analysis.
4. Visualization and Analysis:
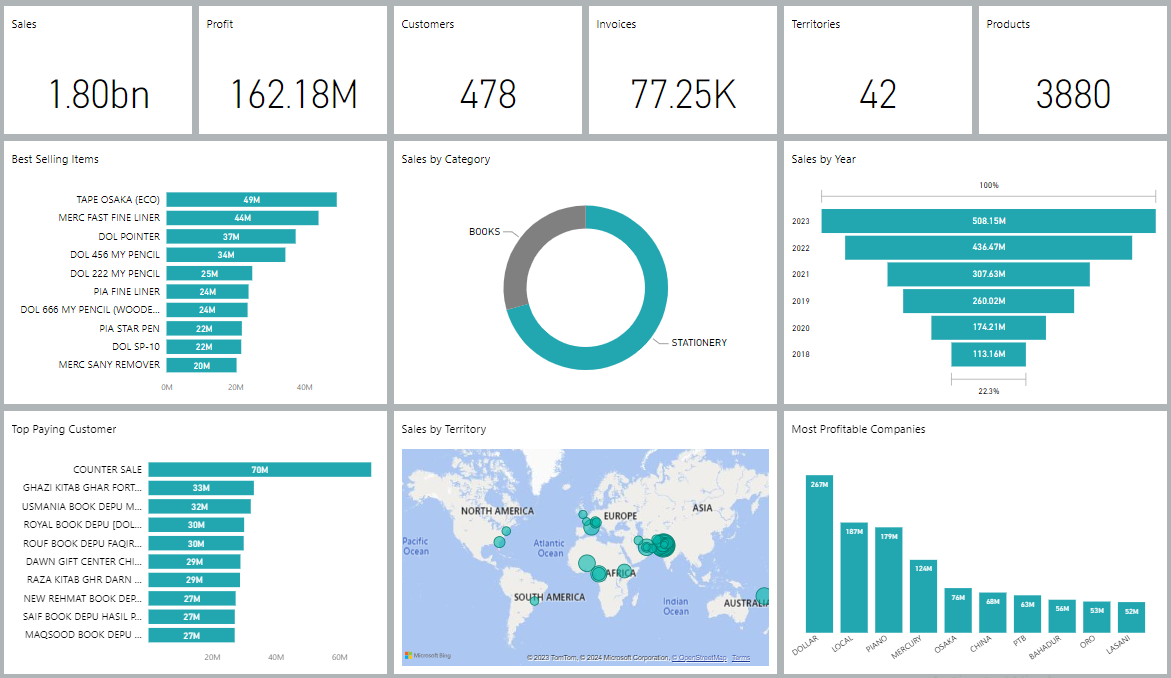
Developed a variety of visuals and charts in Power BI to highlight key factors in sales analysis.
5. Key Features:
Best Selling Items: Visual representation of top-performing products based on sales volume or revenue.
Top Paying Customers: Identification of customers contributing the most to overall sales revenue.
Sales by Company, Category, and Territory: Comparative analysis showcasing sales performance across different segments.
Time Series Analysis: Visualizations depicting sales trends over time, facilitating historical analysis.
6. Key Performance Indicators (KPIs):
Implemented KPI visuals showcasing total sales, total profit, total products, total customers, total invoices, and total quantity sold. Presented KPIs to provide a quick snapshot of overall sales performance and business metrics.
7. Insights and Outcomes:
Identified best selling items and their performance across different categories and territories. Recognized top paying customers contributing significantly to overall sales revenue. Analyzed sales trends by company and conducted time series analysis, allowing stakeholders to make informed decisions based on historical data.
Dashboard
Report
Conclusion:
The 'Optimizing Sales via CRM and Analytics' project effectively utilized data extraction from SQL Server, manipulation in MySQL, cleaning in Excel, and visualization in Power BI to derive actionable insights and KPIs from sales data. By normalizing the data for efficient analysis, the project empowered stakeholders with visual representations and key metrics, aiding in strategic decision-making and improving overall sales performance.