Case Study
Introduction:
The project involved the processing, transformation, and visualization of sales data obtained from Kaggle. Utilizing MySQL for data manipulation, Excel for cleaning and preparation, and Power BI for normalization and visualization, the project aimed to extract actionable insights and visualize key performance indicators (KPIs) for comprehensive sales analysis.
Project Overview:
Objective: To analyze Northwind sales data by combining tables in MySQL, cleaning in Excel, normalizing in Power Query, and visualizing insights in Power BI. Emphasis was placed on identifying best selling items, top paying customers, sales by company, category, territory, and conducting time series analysis.
Project Phases:
1. Data Acquisition and Transformation:
Obtained raw sales data from Kaggle and imported it into MySQL for data transformation. Combined required tables and columns in MySQL, performing joins and data restructuring as needed.
2. Data Cleaning and Preparation in Excel:
Conducted thorough data cleaning in Excel to rectify inconsistencies, address missing values, and format the data uniformly. Prepared the cleaned dataset for importing into Power BI.
3. Data Normalization using Power Query in Power BI:
Imported the cleaned data into Power BI and utilized Power Query for further normalization. Split large columns into smaller ones for improved performance and reduced redundancy. Created a robust data model to optimize analysis and visualization.
4. Visualization and Analysis:
Developed a wide array of visuals and charts in Power BI to emphasize key factors in sales analysis.
5. Key Features:
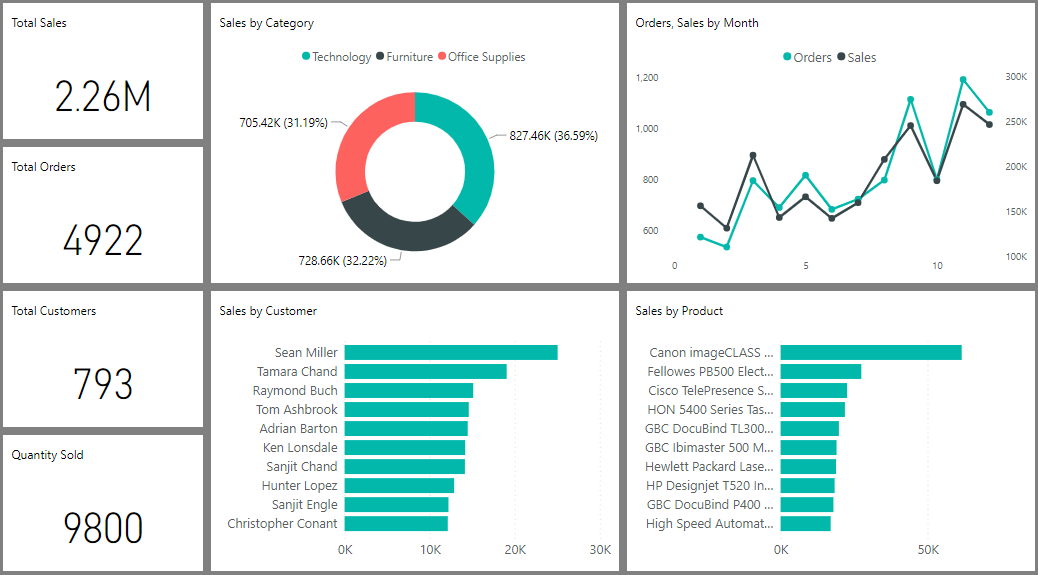
Best Selling Items: Visual representations showcasing top-performing products based on sales volume or revenue.
Top Paying Customers: Identification of customers contributing the most to overall sales revenue.
Sales by Company, Category, and Territory: Comparative analysis displaying sales performance across different segments.
Time Series Analysis: Visualizations depicting sales trends over time, including sales by year and sales/orders trends.
6. Key Performance Indicators (KPIs):
Incorporated KPI visuals representing total sales, total profit, total products, total customers, total orders, and total quantity sold. Presented KPIs to offer a quick snapshot of overall sales performance and business metrics.
7. Insights and Outcomes:
Identified top-selling items and analyzed their performance across categories and territories. Recognized high-value customers significantly impacting overall sales revenue. Conducted comprehensive sales analysis by company, category, and territory, providing actionable insights for strategic decisions. Conducted time series analysis, uncovering trends and patterns in sales over different periods.
Dashboard
Report
Conclusion:
The 'Unveiling Sales Patterns of Northwind's Sales Data' project effectively transformed raw sales data into actionable insights and KPIs using MySQL, Excel, Power Query, and Power BI. By normalizing the data and creating robust visualizations, the project provided stakeholders with valuable insights, enabling informed decision-making and driving improvements in sales performance.